For the project deliverable in this class, you will create a “webapp” using streamlit.
The purpose of the “app” will be to provide a tool for fitting histograms to statistical data. The interface should include:
A way for users to enter data. This should include:
A data entry area for users to enter data by hand
An option to upload data in the form of a CSV file
The ability to fit multiple different types of distributions, such as normal, gamma, weibull, and other miscillaneous types.
Each distribution object in scipy has a fitting function, which returns the relevant parameters.
Your app should provide at least 10 different options
A visualization of the data and the fitted distribution (i.e. a graph)
An output area that shows the fitting parameters with some information about the quality of the fit (e.g. average error or maximum error between data and curve).
The app should also provide a ‘manual fitting’ option, where users can adjust sliders to control the various parameters of the current distribution.
The layout, such as use of tabs, columns, expanders, etc are up to you, but marks will be given for ‘esthetic appeal’ and clean layout.
The app should be contained to a single page (so avoid the use of Streamlit’s multipage option), and uploaded as a .py file to the LEARN Dropbox.
Bonus marks will be given to students who post their app on Github, and deploy it to the Streamlit Community Cloud
You are welcome to use genAI to assist with this project. You can get access to many coding agents if you use Co-Pilot in VSCode. Access is free through the University, though I can’t quite recall how to set that up.
Figure N.1: Distributions are everywhere
N.1 Using scipy.stats Objects
The scipy.stats module contains manydistributions which can be used to either generate data that follows a distribution, or to fit a distribution to given data. In this project we’ll use the latter approach. This approach is actually pretty straight-forward, as demonstrated below.
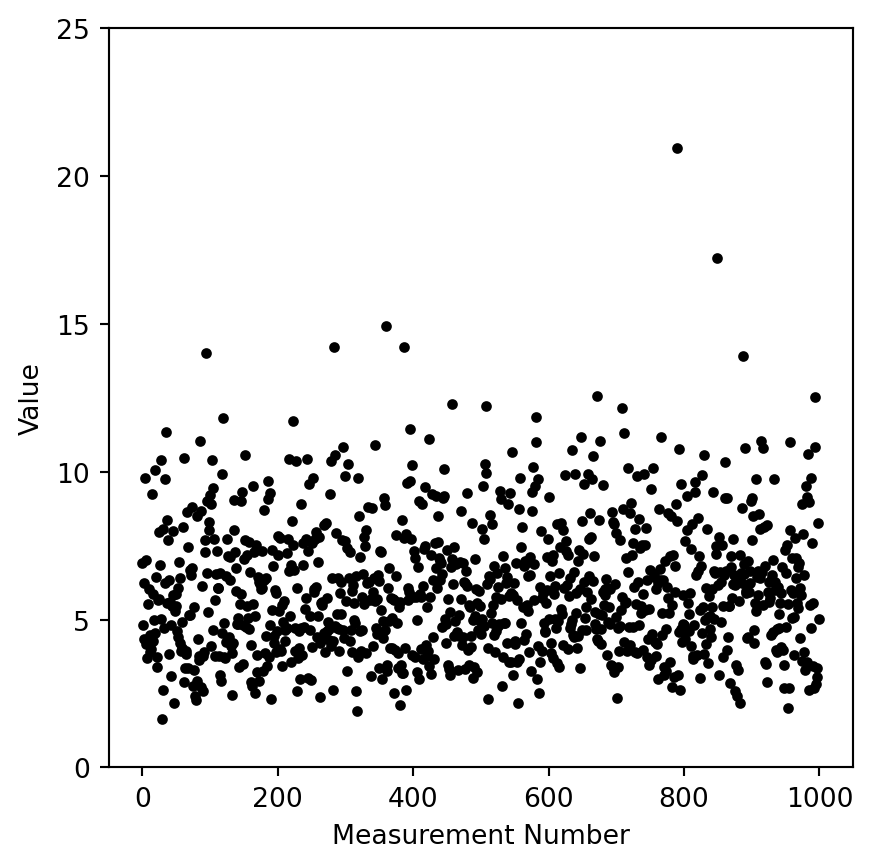
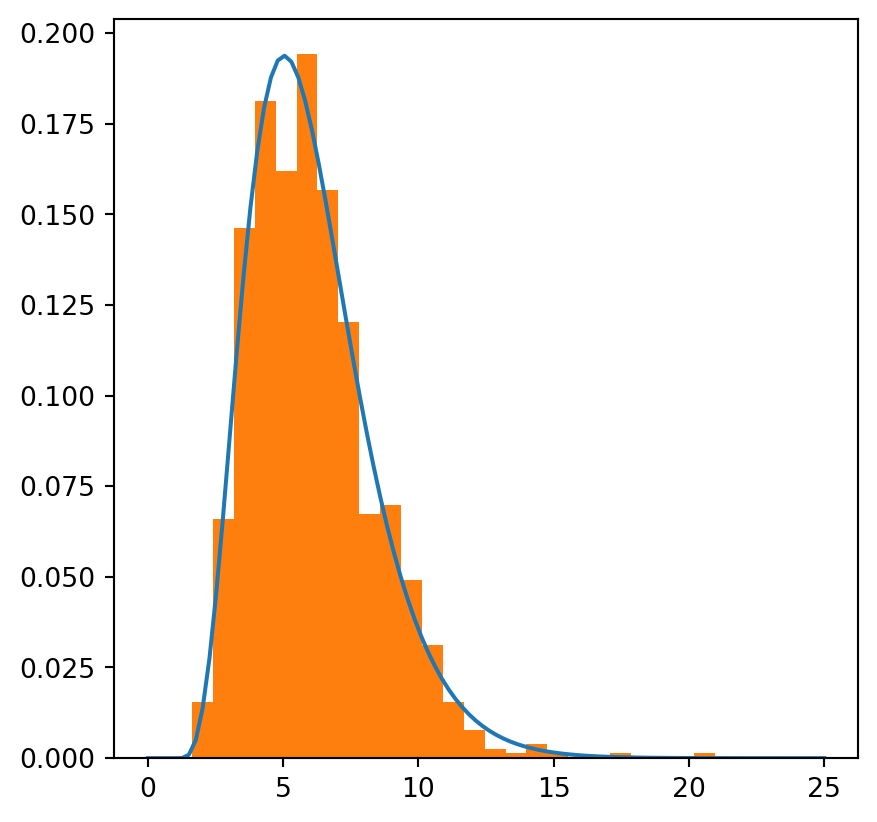
First let’s generate some data using a gamma distribution with parameters of 5, 1, 1.